Green Map takes it to the Wall, with Connections! This great example was created by Mary Hunt, Port Townsend, Washington state - she's the mapmaker at JCCWP.org, a terrific communicator, gardener and plant-based cook. Her story is compelling and we are delighted to share it here!
"After the first two years of Covid self-imposed isolation, the community of Port Townsend, WA was feeling a bit disconnected. To bring this small town back together and talking, a few brave souls teamed up to create a Connectivity Fair whereby 70 local organizations gathered with tables and brochures in one of the school gyms. It was a well attended and met its goal of getting the community talking again.
What's more connective than a Green Map?
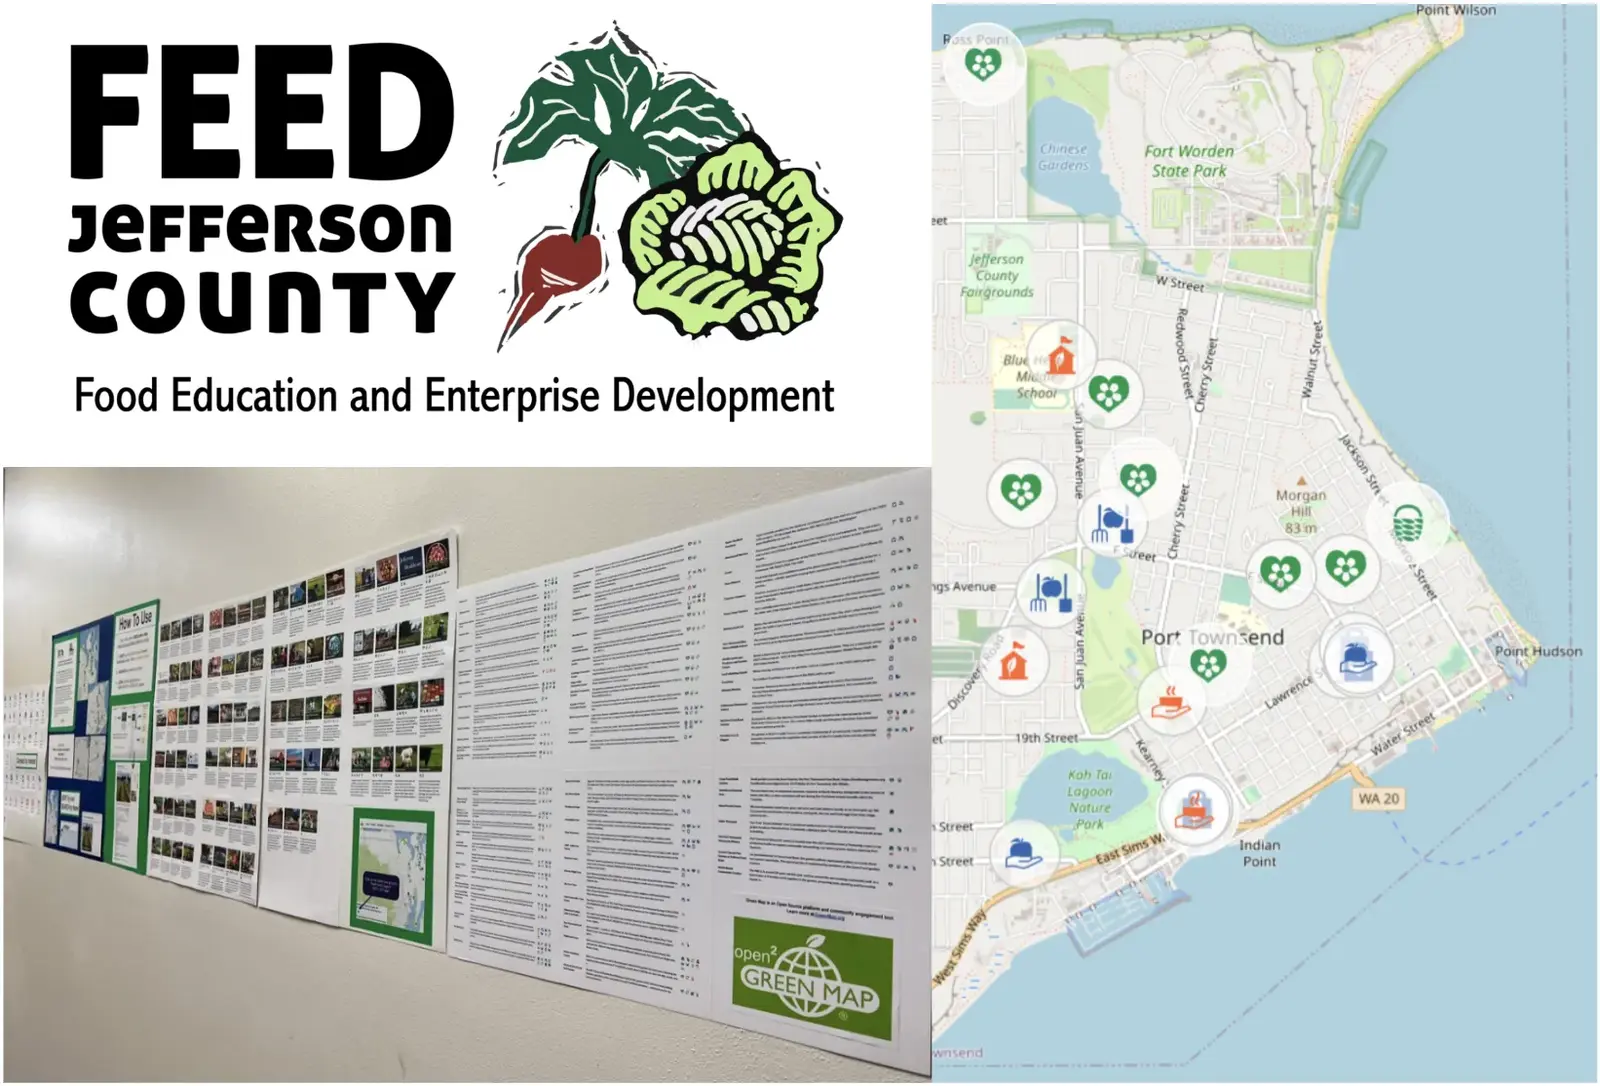
One of the organizations at the event was the Jefferson County Community Wellness Project. Their focus is on "Farm to Fork" education at the local schools. Besides offering information at their table, a 15 foot display of their FEEDJeffco Green Map was the eyecatcher - it charts Food, Enterprise, and Educational Development. While the FEEDJeffco Map has been available on the Green Map Platform for the past couple of years, many in town had yet to try it out, let alone understand the depth of information it contained and the ease with which you could access it.
The set up -- Icons, How to Use, and Data displays:
The Icon display led the visual. Mounted 3 inches high and eye level, each of icons used on this map captured the attention of those walking by on their way to the gym.
Next came the How to Use section, but most skipped over that section and went to look at the Data displays.
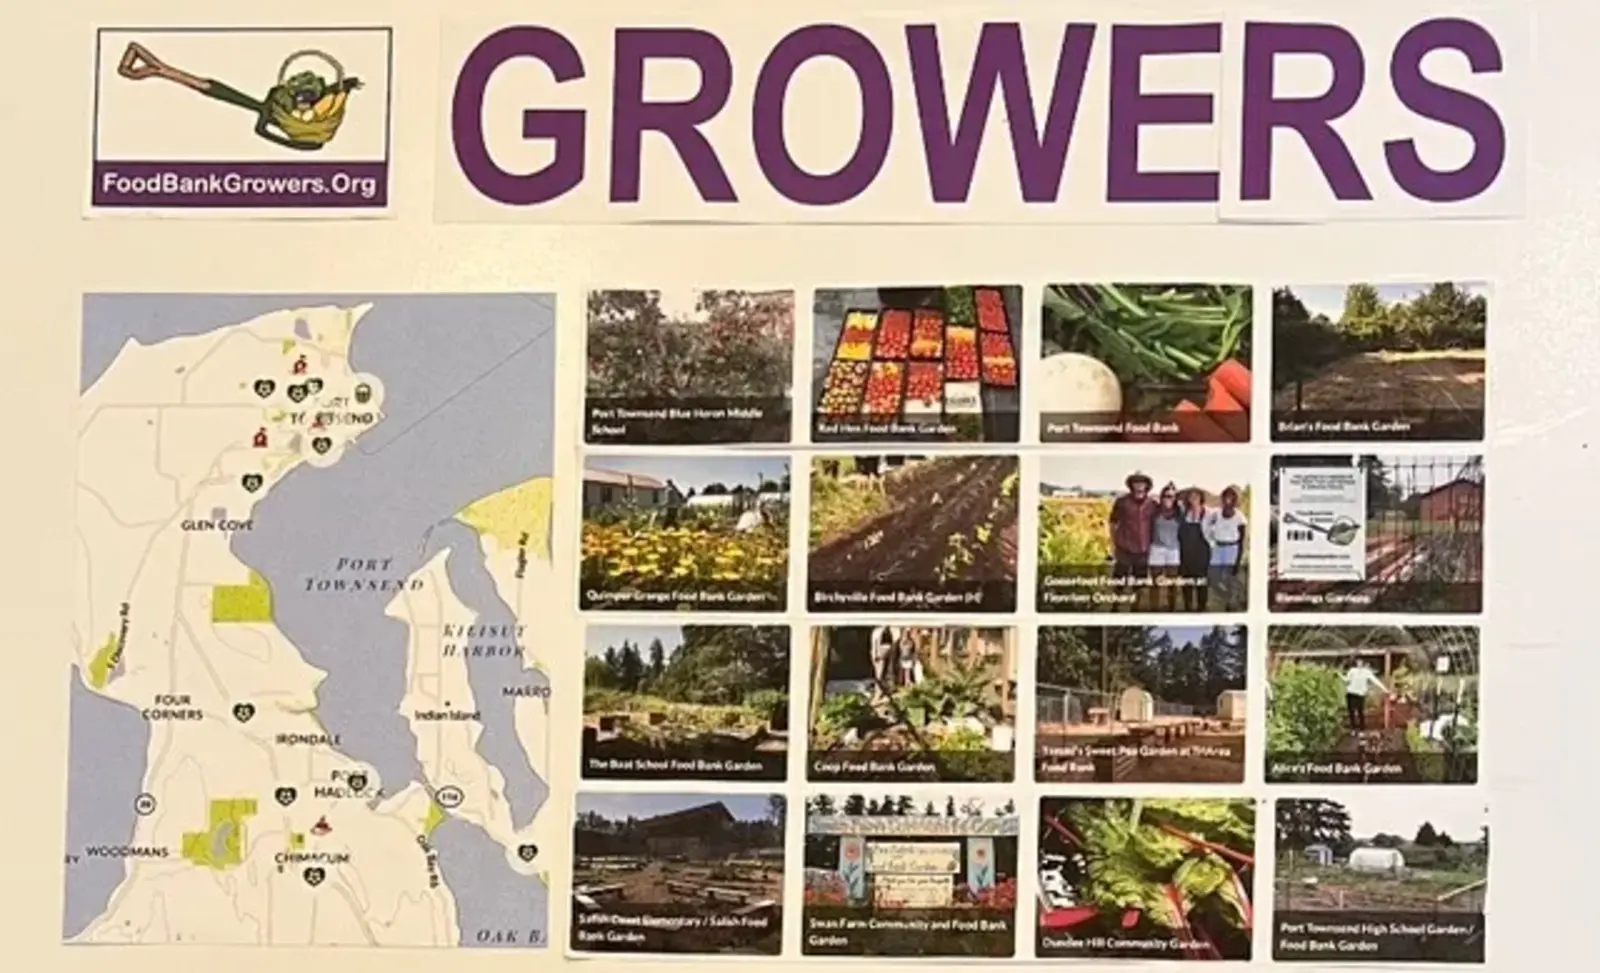
The thumbnails of each featured site was followed by the Data display. This quickly told the story of how each site served many functions.
Poster includes the Platform map's site covers for quick recognition
What happened?
Attendees stopped and gave the icons a hard look, then were drawn to the Snapshots/Data information. After seeing the depth of information and how it could be sorted in seconds, they went back to the middle section, read more, and took pictures to follow up. Many had questions on how to create their own Green Map after they understood that one site could be shown on many different maps of our small community which has lots of crossover of needs. They also liked the introduction to the "Snap to Map" campaign option. It was a great way to connect ideas, people and sustenance."
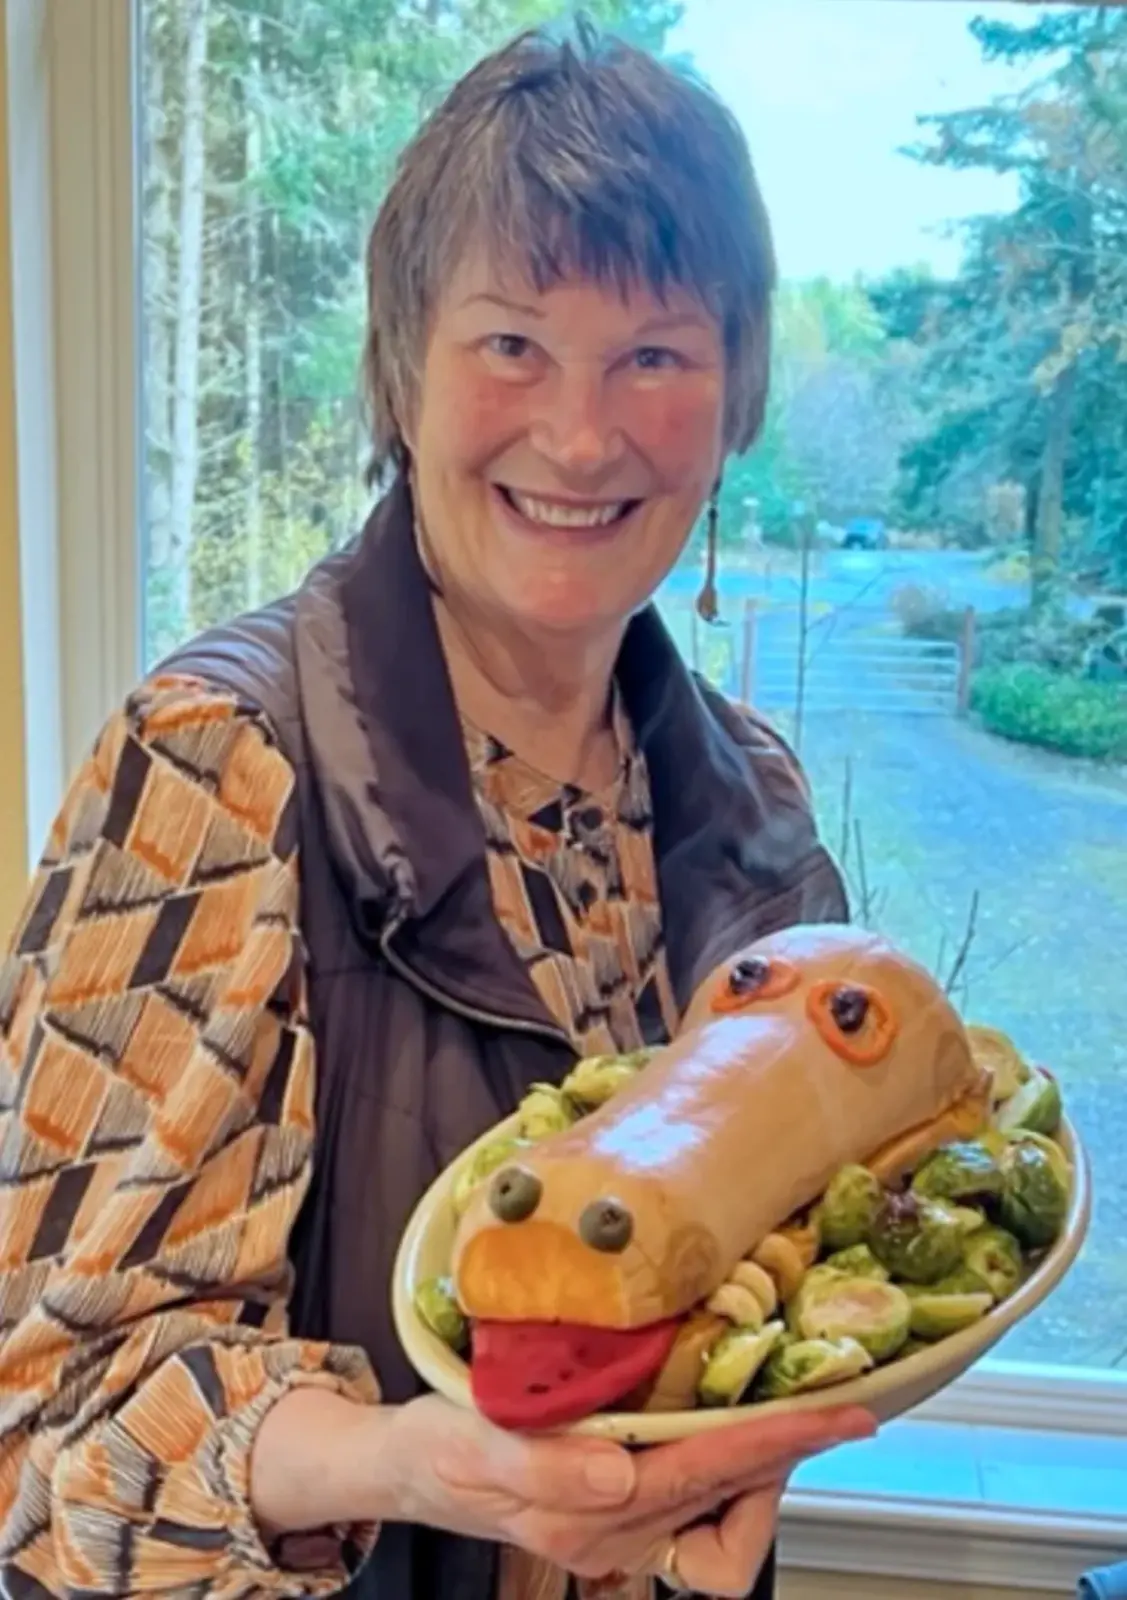
Mary Hunt and homegrown friend
Mary's assessment is valuable for each of us making a map to benefit the community, and wondering how to bring it to light. In this case, people are directed to the organization's website to see the map, rather than directly to the Platform, where there are both comprehensive and selected sites Foodbank Growers editions. Mary's work was featured in our recent Food Security Mapping conversation - see it here! Our thanks to this most productive and thoughtful Green Mapmaker!